Projects
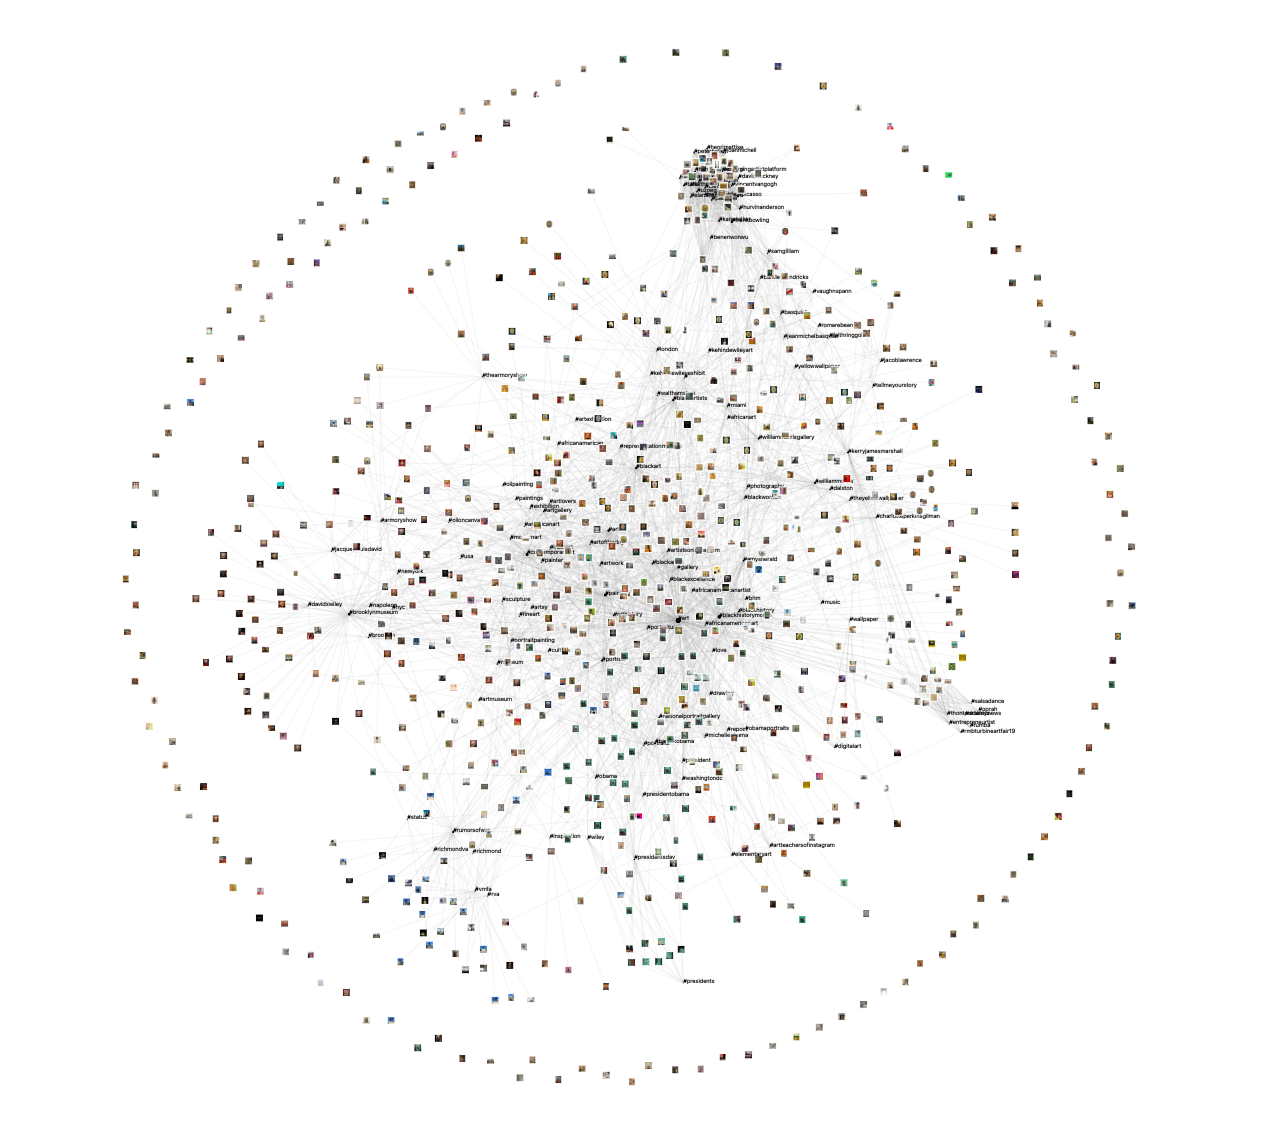
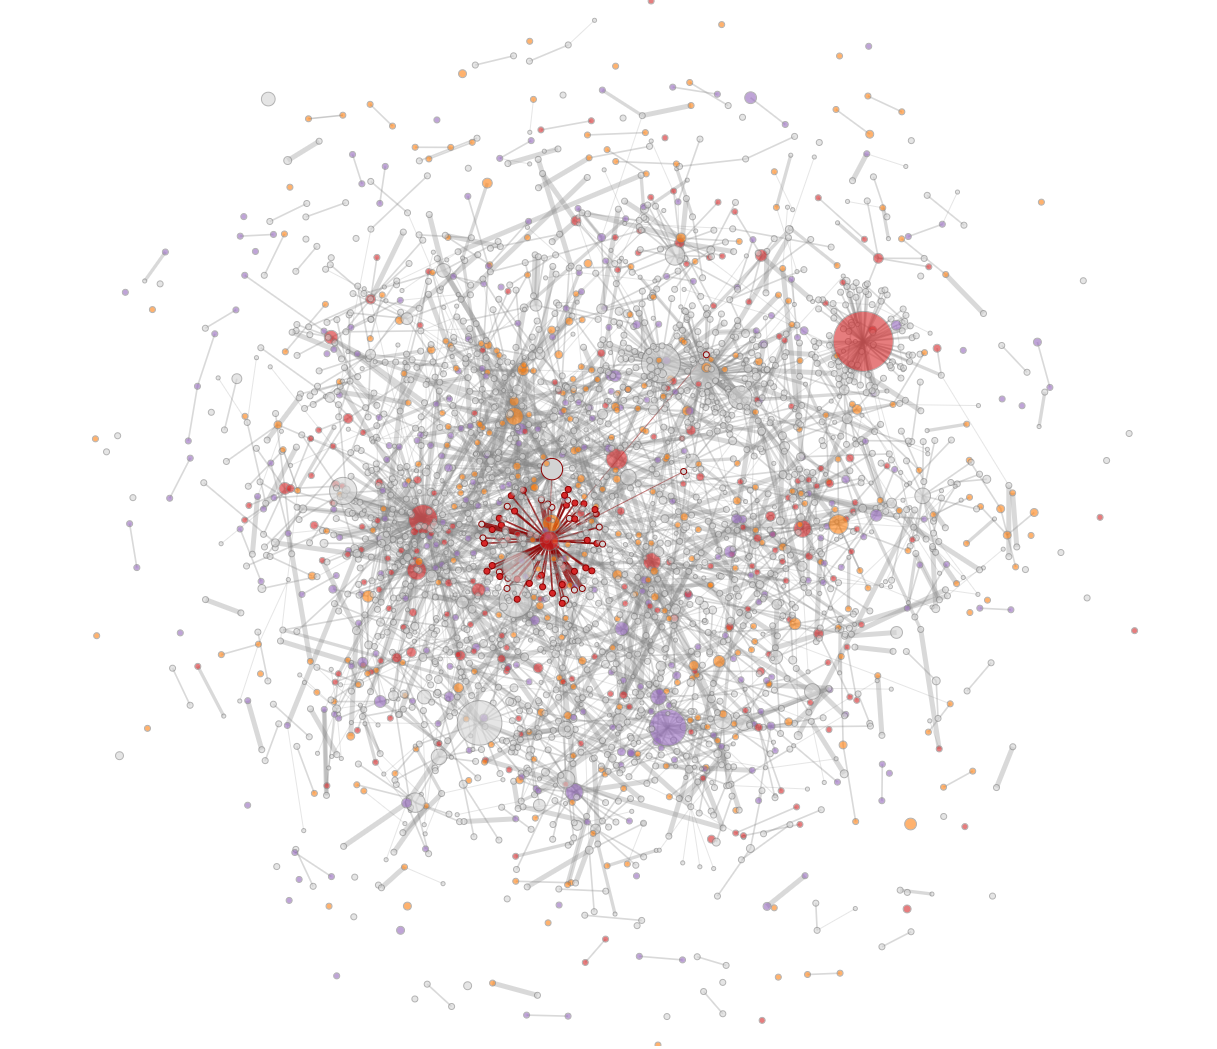
Instagram Hashtag Networks
Network Visualizations of Instagram posts and their hashtags related Public Artwork. Posts are from 2018-2020.
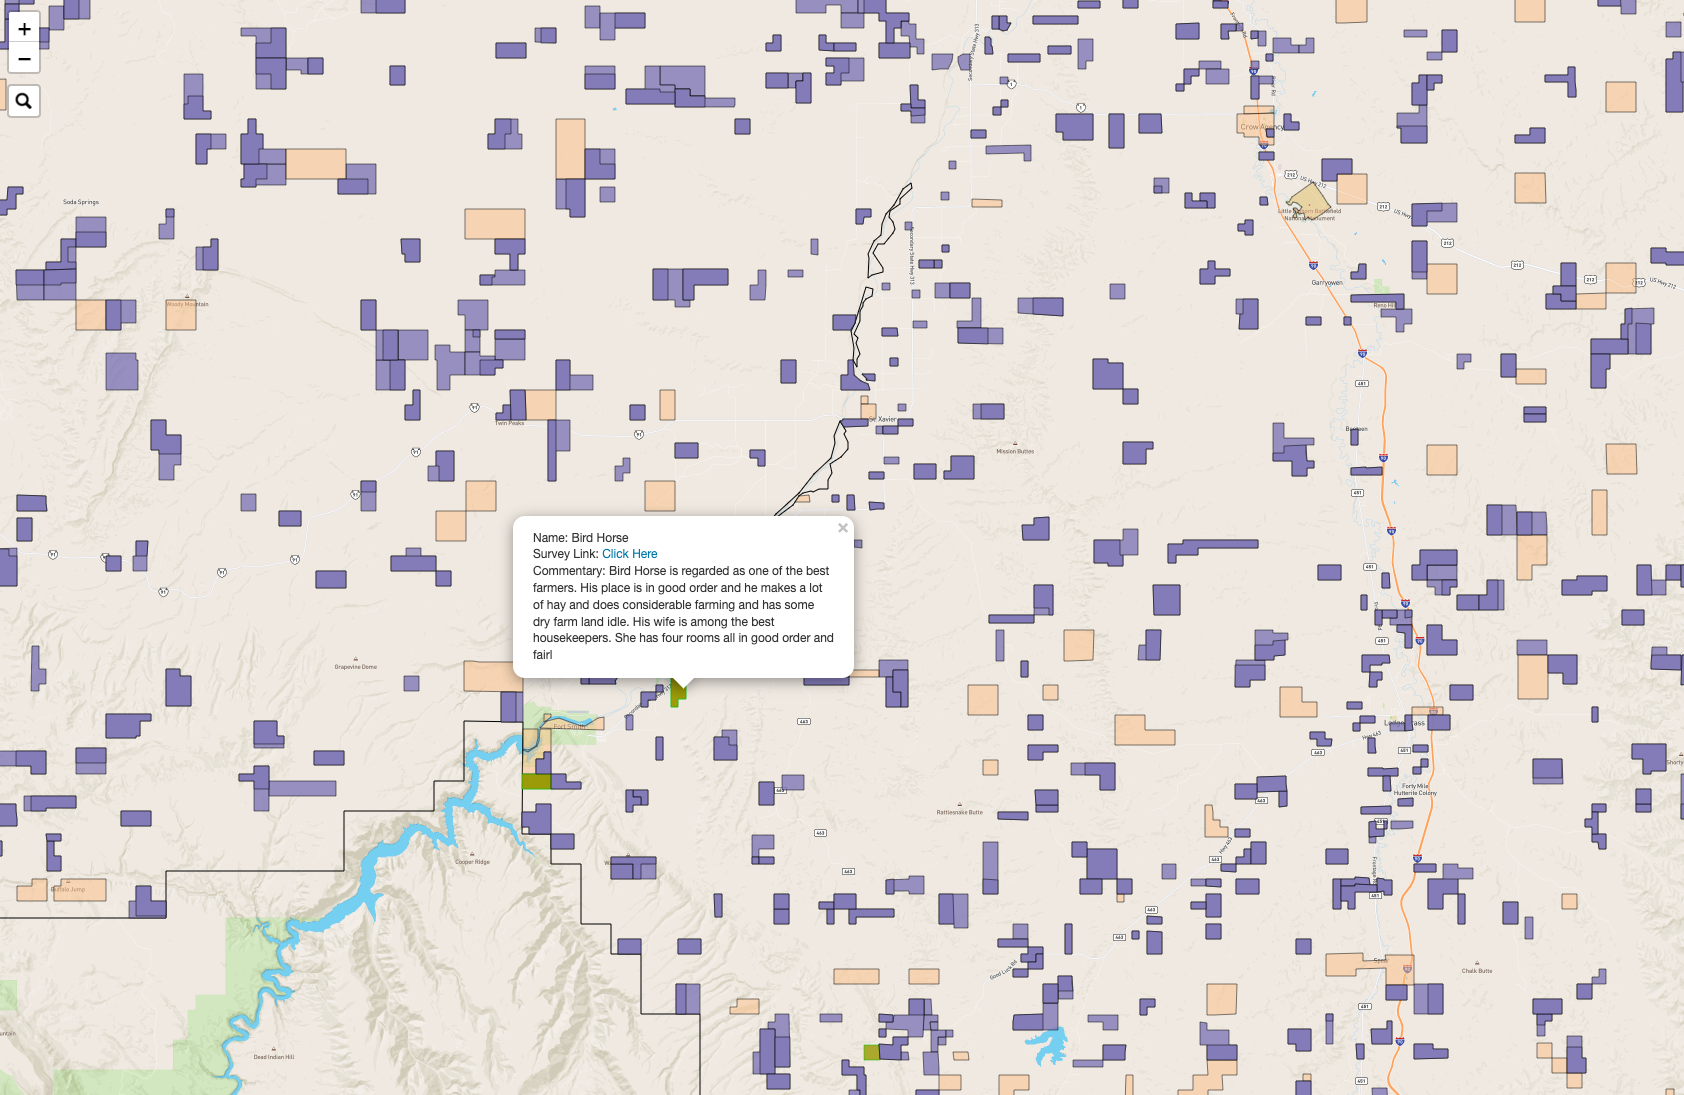
1923 Crow Maps
Maps of every allotment on the Crow Reservation from 1923, showing land parcels and their heads of household.
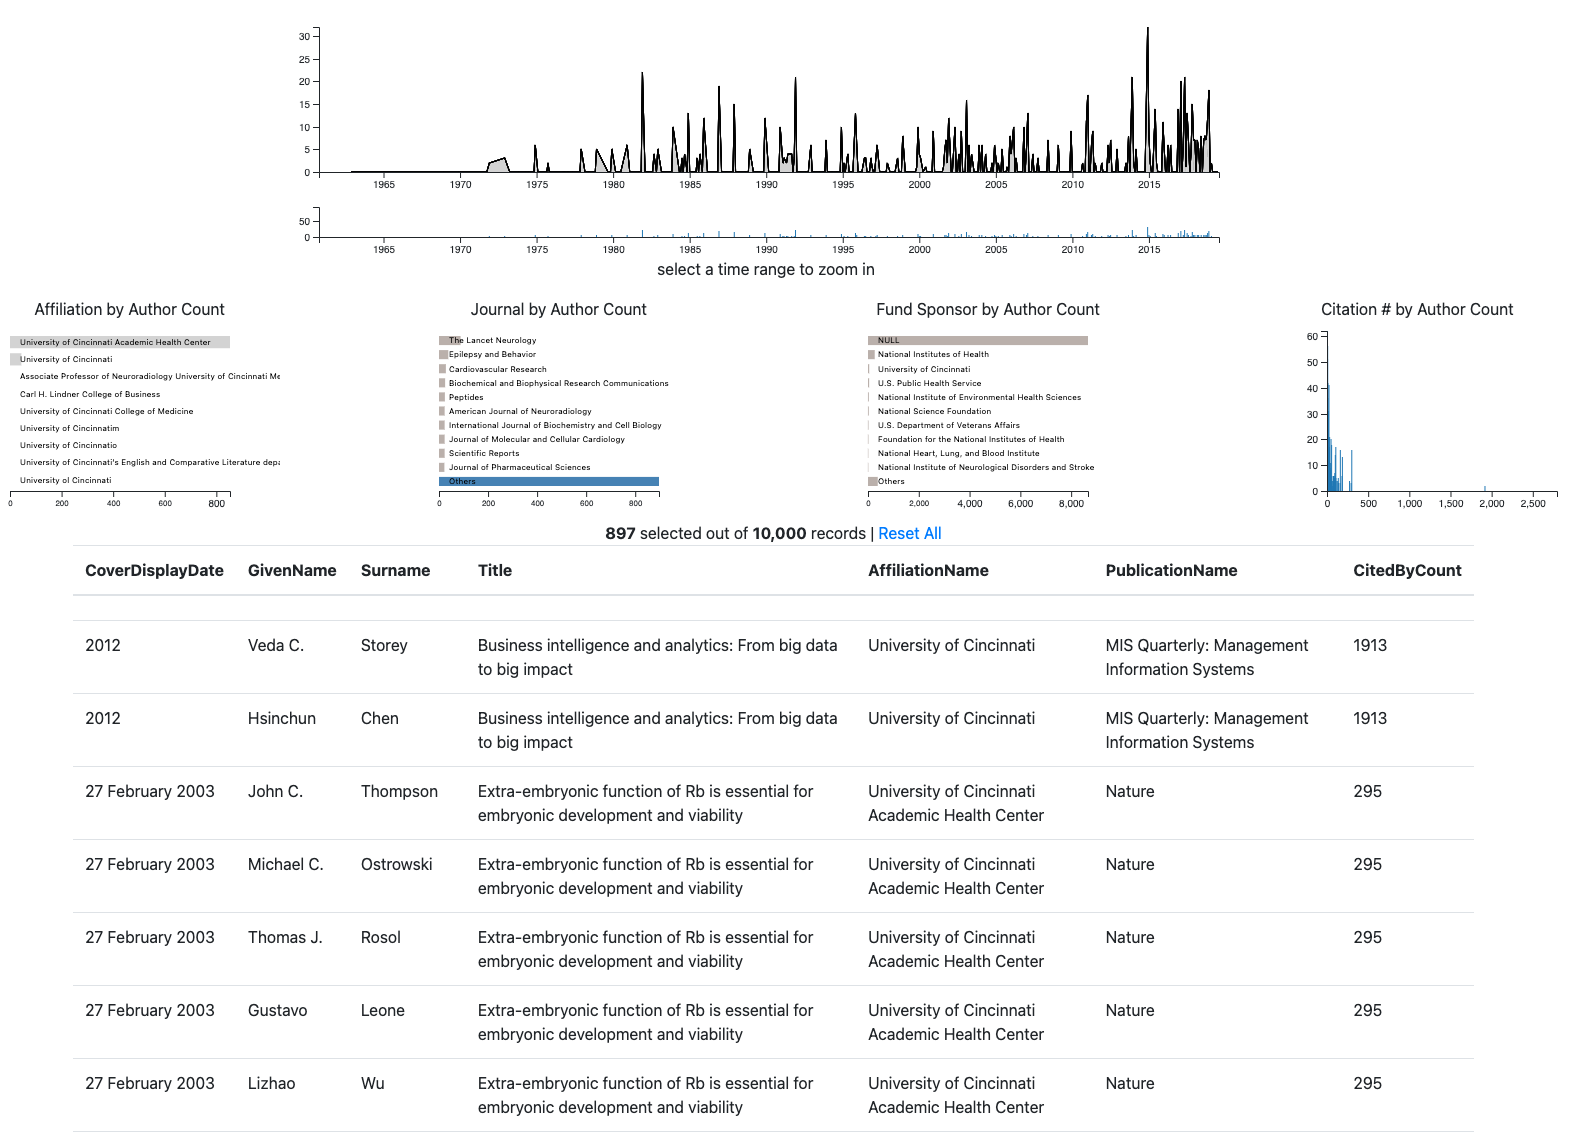
UC Published Documents Dashboard
Dashboard showing 10,000 publications by UC affiliated researchers, allowing you to filter by various attibutes.
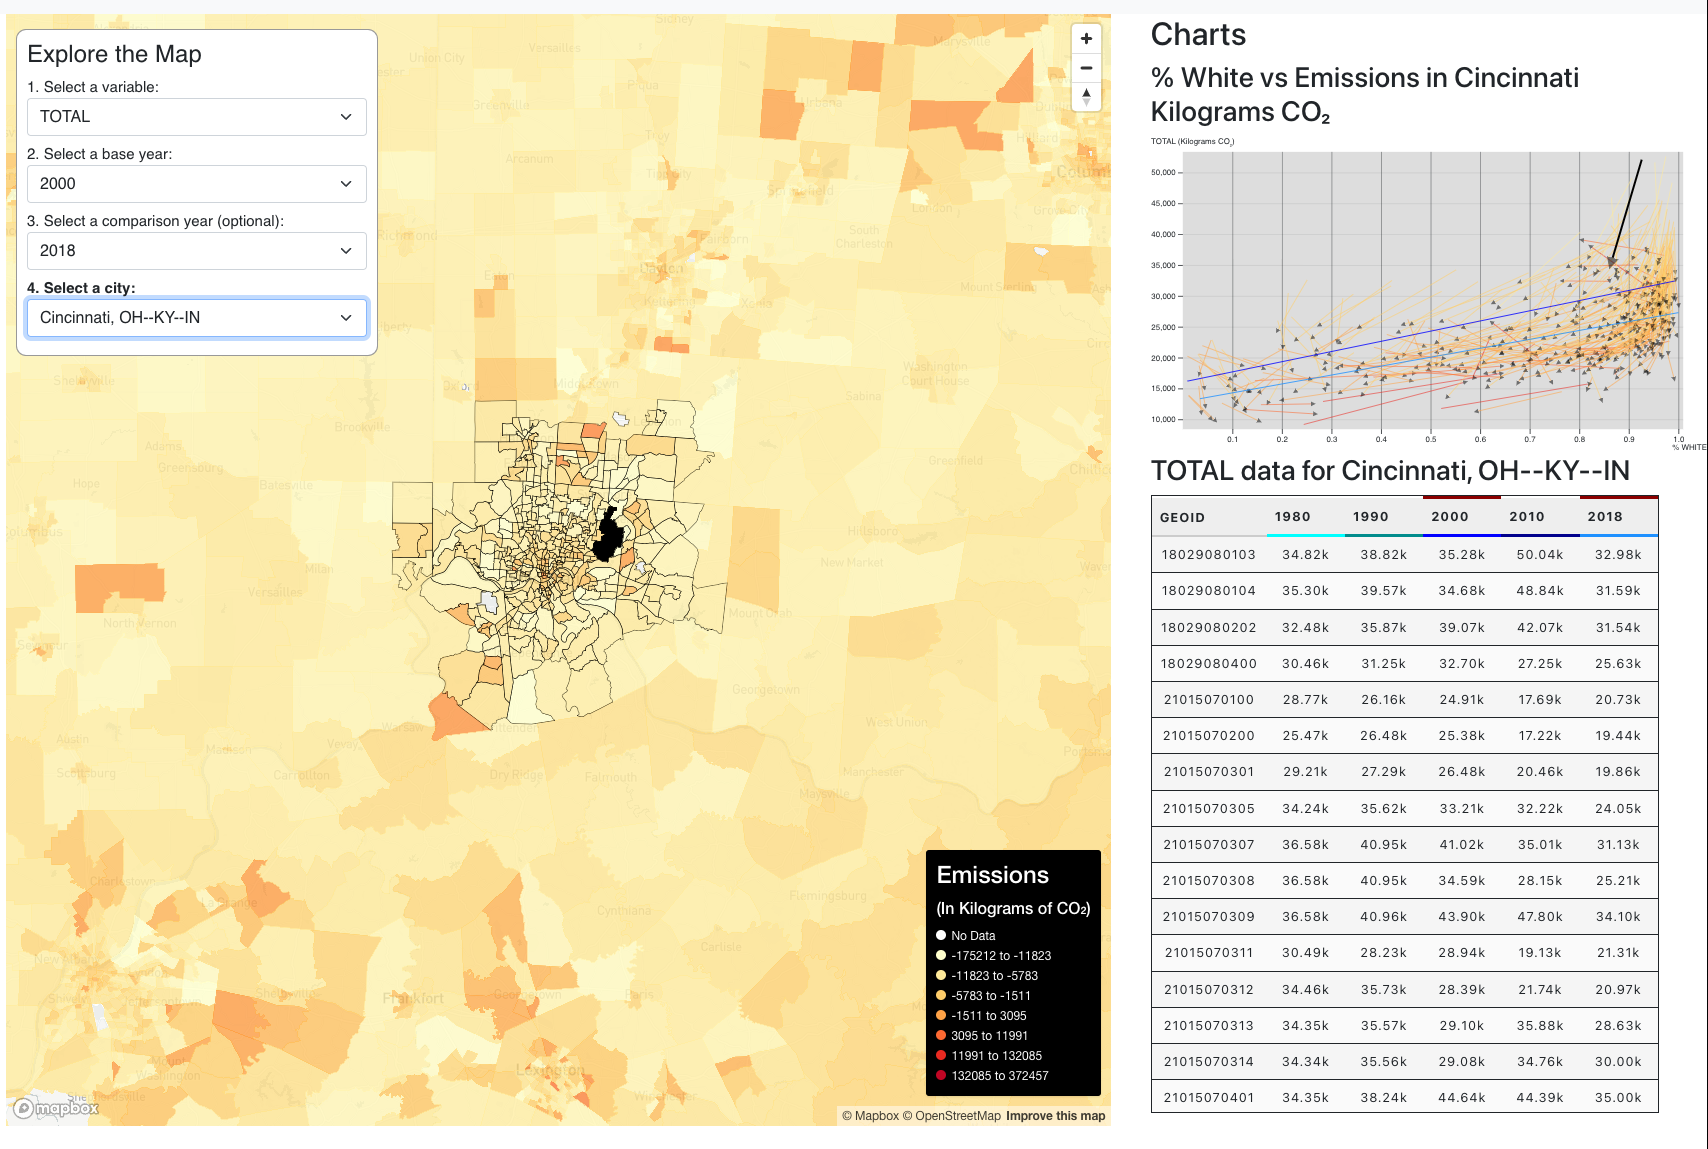
CO2 Emissions and Race
Maps and Visualizations showing the relationships between race, income, and CO2 emissions for select cities, from 2010
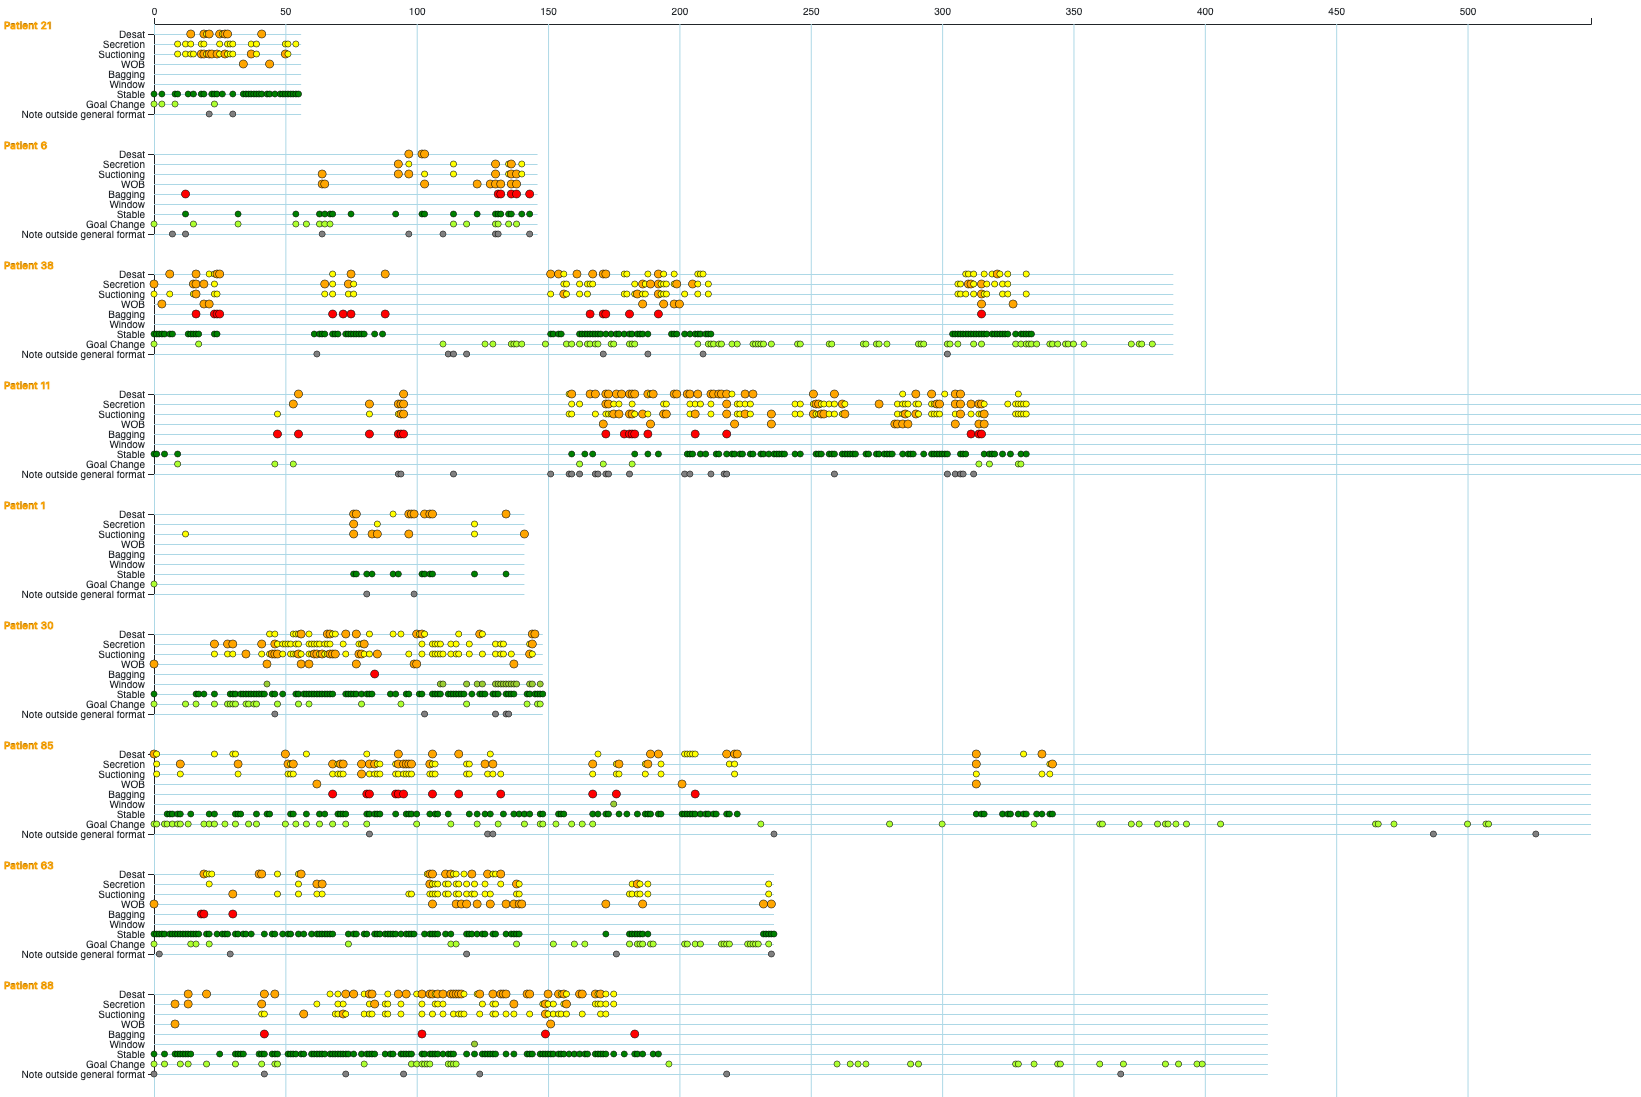
Ventilator Timelines
Timelines showing severity of events in newborns on at-home ventilators, for medical exploration
Defining the Anthropocene in the 20th Century
LDA Models using derived Bag-of-Words data from 2100 best-selling 20th century novels

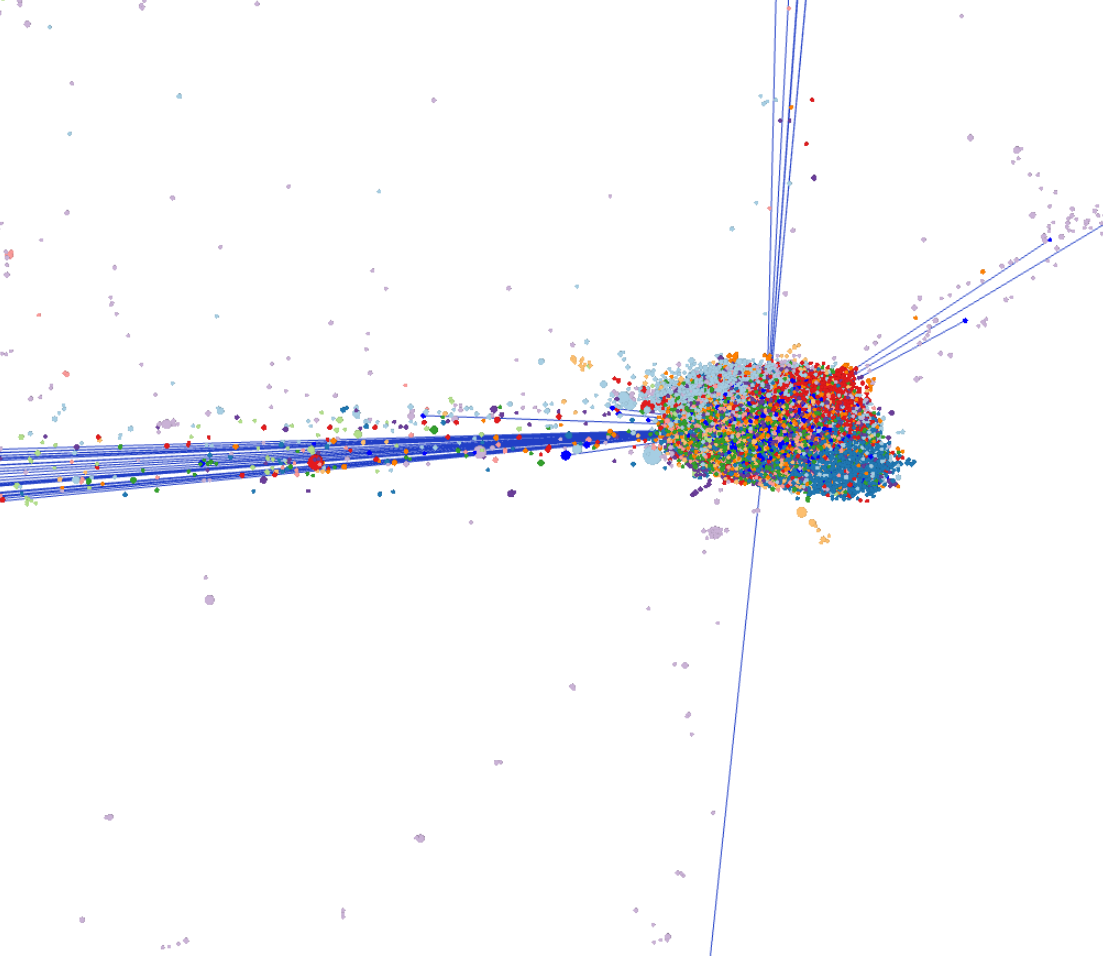
Dakota Access Pipeline Twitter Networks
Twitter user interaction networks from the DAPL protests. From archive.org archived tweets
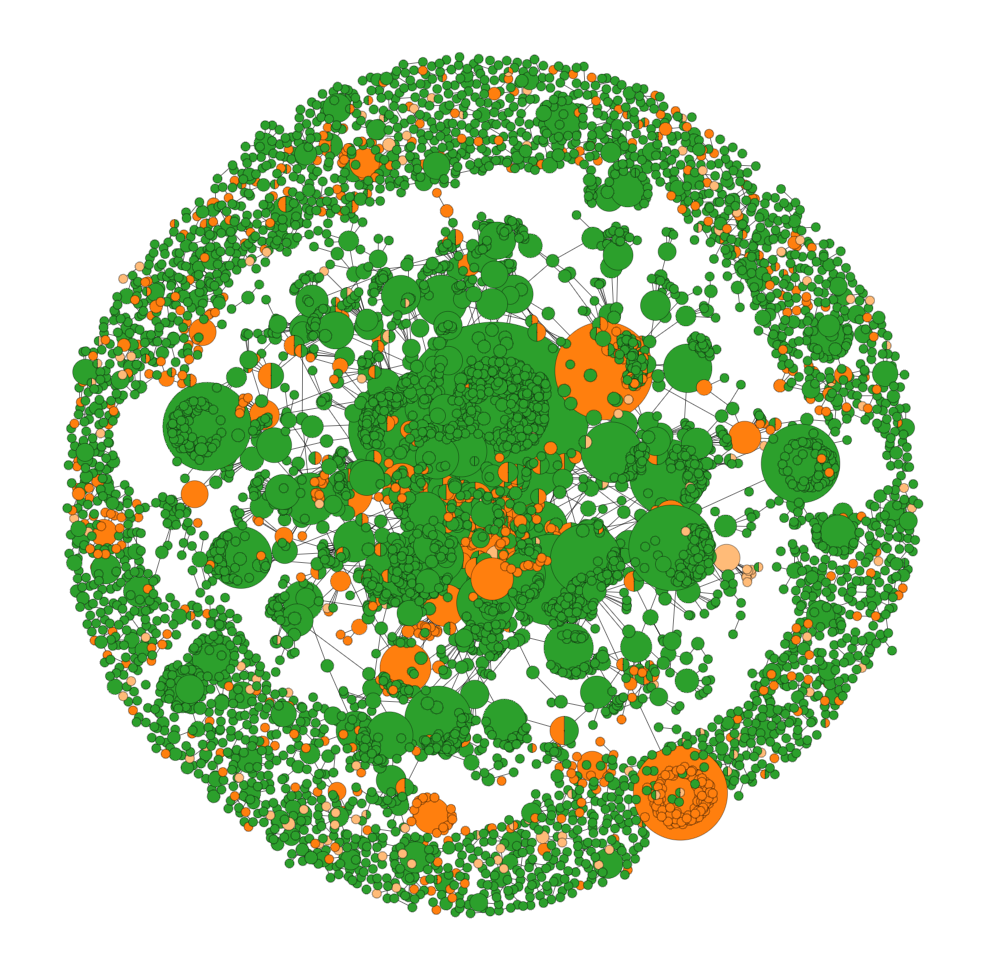
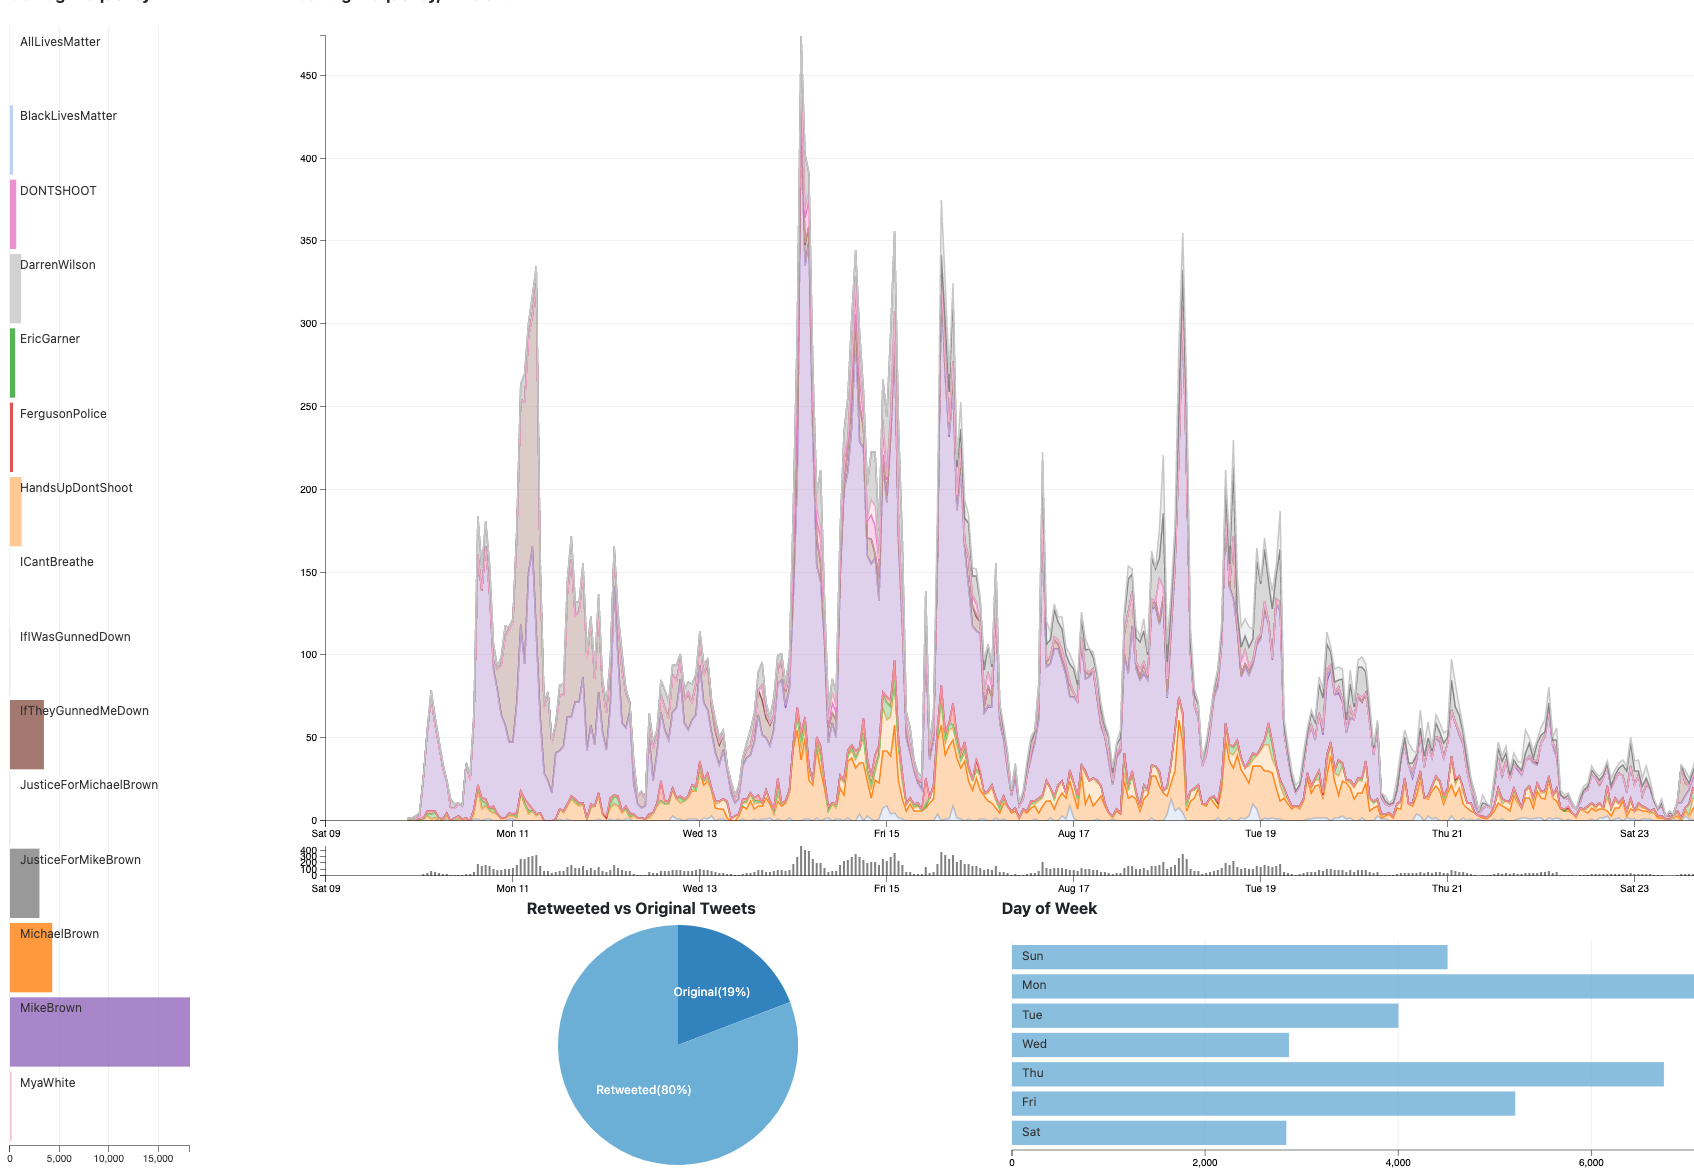
Ferguson Twitter Networks
Twitter user interaction networks from the Ferguson protests and ensuing events. From archive.org archived tweets.
Presidential Debate Twitter Networks
Twitter user interaction networks from the 2016 Presidential Debates. From archive.org archived tweets
Hydroxychloroquine Twitter Networks
Twitter user interaction networks from the first six months of 2020, exploring Hydroxychloroquine information.